Your business in the Gartner Hype Cycle

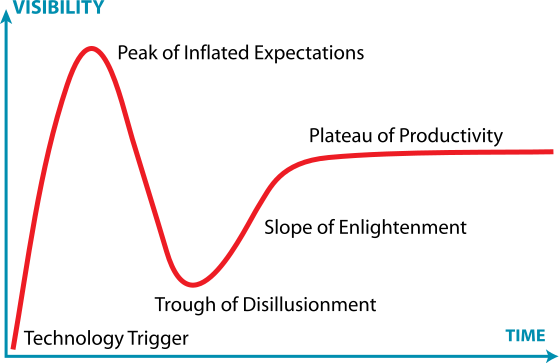
File:Gartner Hype Cycle.svgI was recently asked to contribute to a series of articles for the Scalable Startups project at UC Berkeley. The first of my articles is now up and available for reading.

“Most new businesses that are based on new technology of any kind are at the mercy of the Hype Cycle.”

The gist of the article is that knowing where you are in the hype cycle is an important part of startup self-awareness.

Comments welcome!

Incentives without pricing?

When I get to refilling a prescription on the CVS website I am amused, and then sickened, by the announcement that “Price will vary based on insurance”. When I click on the link “Why can’t you tell me the price?” I get the response in the pop-up as shown in this screen-capture.

image

I could complain about the fact that they do have my insurance details on file and could at least tell me the the expected price assuming my insurance doesn’t change by the time I pick it up in two hours.

However, this is just the tip of the proverbial iceberg. Ask your doctor how much that blood test will be – he or she will likely not even know what the “list price” is, let alone what the negotiated rate for your insurer, or the status of your annual deductible. If you are referred to a specialist you can’t shop by price for the same reason.

This means that all this market based reform which is supposed to incent patients to use healthcare services “more wisely” is crippled from the beginning. If I can’t find out how much something costs ahead of time, how can I decide which is the cheapest. It goes without saying that I can consider various quality metrics to my thinking (some of which are possible to find ahead of time), but come on, be serious! Consumer oriented market based incentives without pricing information – it’s a fallacy.

Happy Chanukah

2012-12-10_18-58-50_508

My family, along with many others, is currently celebrating Chanukah, which is a minor Jewish festival made more significant only by its proximity to Christmas. I am blessed with family, friends and good health and am glad to celebrate even as the days get shorter and colder, and the bicycling season (in Boston, at least) draws to a close. The theme of light in dark times is universal, and Chanukah is a joyous reminder that darkness is driven out not by more darkness but by light.

As a Venture Cyclist this whimsical Chanukah Menorah is a particular treat, although I am looking for a recumbent version for future years!

Big data (very) geek humor

Hat tip to Paul Bleicher, love this very geeky take – from 2009 – but just as relevant to today. (Cartoon by John Muellerleile.)

fault-tolerance

Should an Angel Investor also get Advisory/Board Equity?

It’s demo day time of year in New England. Last month was the big MassChallenge finale. Last week was demo day for BetaSpring in Providence, RI, as well as for HealthBox Boston. This week it’s Techstars Boston Demo Day. One thing most of the presenting companies have in common is that they are raising seed investment funds from the angel, micro-VC and VC communities.

Over the last couple of years entrepreneurs have asked me a few times about cases where a potential angel investor, often someone who has been a mentor to the company in the program, says that they want to invest, but that they also want extra equity for being an advisor or board member, because they “bring more to the table than just money”.

Those people may be right. Some angels can indeed offer more than just money, but the decision about who should be an investor is different from who should get equity for advisory or board help. Equity is very precious, and so advisory or board equity should not be granted lightly.

Here is my advice.

  1. If someone can be really helpful, the chemistry is good, you like them and you think they can bring great value as an advisor or board member then you should be willing to bring them on in this kind of role and grant them some equity, whether or not they invest.
  2. If someone is your lead (or a major) investor and their terms are to require a board seat (plus equity) then you can decide whether or not to accept those terms, negotiate them or reject them.
  3. If someone is joining an existing structure for a seed investment but insists on this extra role and equity you can politely say that you are keeping those elements separate, and they are welcome to invest but you are not linking the two at this time. This may mean turning down an investor. Obviously if you NEED them to make the round come together then you are back to #2.

Certainly you can approach this cautiously... including asking for references of other CEOs and startups where this angel is filling this kind of role, ideally from companies in similar industries where the extra “sweat” contribution is likely to be similar.

You should make sure the extra equity is common stock (not preferred), that it vests with a one year cliff, and that you have the right to terminate the relationship without cause at any time if you feel the person is not really adding the value that you hoped.

Startups: Dilemmas and Charters

New startups are sometimes formed by teams that have known and worked with each other before, and some are formed by teams that just met each other at a founder dating website or event, and decide to work together after just a few weeks.

In either case, getting the team off to a good start where everyone is on the same page is really important.

Two great books that all founders should read are

partnership-charter            founders dilemmas

When you get started with a good friend, an old friend, or a brand new one, these books show why getting explicit agreements, both formal and informal, on a wide variety of issues can be deeply important in the years ahead.

The Founder’s Dilemmas, by Noam Wasserman, is really focused on tech (and similar) startups that take outside financing and are geared towards a liquidity event (a sale or IPO). The book goes into detail, with great examples, of the things that can (and do) go wrong with alarming regularity. It then examines the dilemmas which are created in deciding how to get ahead of these problems and ways to get through the dilemmas to agreements that are clear, fair and workable.

The Partnership Charter, by David Gage, is a more general look at working together (and not just in tech startups). However, it provides a way for partners to think about, and talk about, working styles, values, accountability and responsibilities, future changes in management and structure and many other key issues. There is some overlap with Wasserman’s book, but the approach is different, and worth the time to read as well.

Look at the reviews on Amazon (and elsewhere), buy the books, and read them!

Talk about re-“cycle”-ing

With a hat tip to John Halamka who brought this to my attention, check out this cardboard bike.

Izhar Gafni’s amazing $20 cardboard bike

If you can’t see the video it is embedded in this write-up of the project as well.

Xconomy: Future of Big Data

BOS_Oct24_300x200_banner_new-220x146I got to moderate the startup panel at the Xconomy "Future of Big Data" Conference in Boston last week.

The audience seemed to really like the discussion which I put down to the great panel members:

Greg Huang's writeup of the event mentioned several quotes from the panel, including my definition of big data ("growing faster than Moore's law") that also got picked up in Forbes.com.

Questions we covered included:

  1. How is your company is using Big Data to disrupt the vertical you're in?
  2. How much of your big data secret sauce is about the data (acquiring, curating, creating)  vs the algorithms and architecture used to process the data?
  3. What has "big data"enabled which was not possible for startups 5 years ago. Could your companies have existed 5 years ago?

Two great quotes from elsewhere in the event were:

Big data is bullshit (Brad Feld)

and

The database people have been asleep, and Oracle has been providing the narcotics (Andy Palmer)

Phase Forward: Remembering the Early Days

2012-08-29_11-03-47_262

I went to Newton City Hall today to run an errand and saw the Balsamo/Millenium walkway that the city created to celebrate the year 2000. I remembered that when Paul Bleicher and I heard about this walkway in 1999 we thought it would be fitting to mark the fact that Newton was the first home of Phase Forward, the company we had co-founded a couple of years before.

In early 1999 it wasn’t clear how successful Phase Forward would go on to be. However, we were proud enough, even then, to have started the company in Newton, where we also both lived (and still do) with our respective families. Starting in 1996 we spent many hours in a study room in the Newton Free Library working on a business plan. Once we received venture capital funding (from Atlas Ventures and North Bridge Venture Partners) we opened our first office at 51 Winchester St, Newton in 1997. It was a couple more years before the company moved out to Waltham. The later history of Phase Forward included an IPO and then a successful acquisition by Oracle Corporation in 2010.

I am very proud that I got to work with Paul on his ideas that became so successful at Phase Forward. We had fun, changed an industry, created a bunch of jobs, and got to see some success along with way.

Hopefully the Phase Forward name will remain clear on this pathway as a mark of our gratitude for starting out in Newton, even as the name fades from prominence now it is no longer an independent company.

Now this is venture cycling!

Check out this wonderful three minute movie – watch to the end – and see how venture capital and cycling really come together.

The Invisible Bicycle Helmet | Fredrik Gertten from Focus Forward Films on Vimeo.

The link, in case everything else fails is: http://vimeo.com/43038579

A Better Definition of Big Data

As I have noted, Big Data is called that because of the problems it causes – it’s too big for this or that kind of processing or usefulness (ever tried looking through a million rows of data for something interesting?) The conventional definition of big data is slightly tautological: data that is big (or “too big”) in volume, velocity or variety for the current generation of hands-on data tools.

The kinds of data driving this big data wave are, as I hinted previously, high granularity data from systems and sensors recording behavior of (and inside) environments, people, markets and machines. This is in contrast to previous generations of data processing, designed to record and analyze the results of behavior, such as events and transactions, but not the behavior itself. In this era of big data, we have reached a new limit – something never usually considered a limit at all. That limit is Moore’s law.

Moore's law is the observation that computer power (for a given price) doubles approximately every two years. For a long time, Moore’s law would ensure regular general-purpose computers would improve fast enough to keep the databases humming with no need for (more expensive) special purpose products. 

Then something happened. IT departments in large corporations started experiencing problems that outstripped the general improvements in computer power being delivered by Moore’s law. New technologies became commercial successes because these IT departments started to spend money on solving such problems. In 1996 TimesTen spun out of HP with a new approach to solve one relational database performance problem and became very successful in its particular corner of the market. Just as TimesTen was becoming successful, Boston-based Netezza launched its own very successful product that was, effectively, a special purpose computer for another key part of the relational database market.

In retrospect, these commercial successes heralded the start of the big data era. They illustrated, with the power of the market (including a great IPO for Netezza, and later acquisitions of both), that data growth was outstripping Moore’s law and new approaches were in demand. Both these companies relied on new arrangements of hardware (with proprietary software) to achieve new levels of performance. However, the big data wave quickly swung round to clever new software designs and algorithms, and clever new ways to parcel out problems to lots of regular computers working in parallel. Along with new hardware, new software approaches are just as powerful in coping with the big data that is outstripping Moore’s law. These include column stores (e.g., Vertica), Google’s famous map reduce algorithm (e.g., Hadoop) and now many more.

All this leads to my definition of big data:

data with velocity, volume and/or variety growing faster than Moore’s law

As a footnote, the recent announcements I covered in May, headlined by Intel’s massive grant to MIT related to big data research, brings this full circle. Gordon Moore coined Moore’s law just a few years before co-founding Intel.

Fundraising for Hazon

Although I am not riding this year, I am fundraising for the 2012 Hazon NY Jewish Environmental Bike ride ... You all (should) know that Hazon is near and dear to my heart in many ways. You can read more about it by clicking through to my fundraising page. If you are able to support this wonderful organization please go ahead and do so!


Click Here to Donate

The $1,000 Genome is old news

I have written a few times about the coming of the $1,000 genome, and what that really means.

I recently read an excellent Forbes article by Jim Golden that argues this is already rather old news. We are apparently close, if we haven’t already arrived, at the mechanical capability for sequencing a whole genome for that price in a few hours. However, to sort through the data we generated for $1,000 and get reasoned clinical knowledge for a patient still costs $25,000-$100,000.

In cancer labs (a hotbed of genetic research), the article notes that whole genome sequencing of tumor tissue will need to be repeated multiple times for at least thousands of patients (there are over 1.4 million new cancer cases each year in the US). Repeating the genetic analysis enables tracking the mutations as a patient undergoes treatment and the tumor changes and responds. The next frontier of genomic-based clinical research is not perfect personalized medicine – that is still way off in the future. The next frontier is about having the opportunity to get insight into the patterns of disease progression, treatment and response. Only after we leverage this lower cost of genome sequencing to amass statistically significant amounts of data for all very many different kinds and sub-types of cancer will personalized treatment become a mainstay of clinical practice.

Golden concludes:

It’s not about the $1000 genome.  It’s about big data generation and analytics for insight creation over the clinical course of a patient’s journey through cancer.

The Four Horsemen of …

12-10-four-net-horsemenA long time ago, around the time of the dot-com bubble, four companies emerged as the tech powerhouses of their time. Sun, Oracle, EMC, Cisco were known as the four horsemen of the new economy. Sun built the computing hardware, Oracle developed the database systems, EMC provided the storage infrastructure and Cisco powered the networks. Sales boomed, stock prices soared, and fortunes were made. After the bubble burst the term “four horsemen” seemed even more appropriate (the original horsemen were harbingers of the apocalypse). Sun never recovered and is now owned by Oracle which continues to thrive. EMC reinvented itself by adding sophisticated document management, security and virtualization technology. Cisco is most closely still like itself. Still, despite the gloomy associations, it appears that people like this four horsemen metaphor.

A year ago Eric Schmidt identified the four horsemen of the internet as Google, Apple, Facebook, and Amazon (also known as the four horsemen of the consumer apocalypse). Recently Michael Boland named Apple, Ebay, Facebook and Yahoo as the four horsemen of digital media (even though it is unclear whether Yahoo can strike fear into anyone’s heart anymore).

According to this post, the four horsemen of cloud computing are Amazon, Microsoft, Google and VMware.

I can’t seem to find anyone else’s view for four horsemen of big data, so here are my picks: IBM (Watson won Jeopardy after all), Google (organizing the world’s information), Apache Hadoop (big data’s favorite open source project right now), and Twitter (400 million tweets per day represents the global rush of random data about everything).

What are your picks for the four horsemen of big data, and why? You have to choose a list of four – more or less is cheating! Answers in the comments please.

Big Data, “Mass” Data

2012-05-30_14-33-39_78Just a few days after I started my Big Data blog series, yesterday was Big Data in Massachusetts day. I was fortunate to be in the crowd at the Stata Center when MIT, Intel and the Commonwealth of Massachusetts launched a whole series of Big Data initiatives in Boston and Massachusetts. The MassTLC has a nice summary blog post here.

As a region, we are staking a claim to be the place for big data innovation. I think this is a well-founded claim and I think Boston will rise to the opportunity.

My first big data post talked about the rise of behavioral data as the driver of big data. I also alluded to systems being observed in finer detail, and instrumented in real time. A broader look at this deluge includes some of these factors not necessarily all based on behavior, although finer granularity really does elucidate system behavior much more readily. One example is data generated by genetic sequencing and other life science research such as high throughput screening. Another example is medical imaging, where image file sizes are now huge, because of resolution improvements and massive number of frames (rather than that single xray) per study. This crosses over into behavioral data of living systems when you think of those hi-res videos of a beating heart, or a digital “movie” of radiology guided surgery. In another industry, I was told by someone working in oil and gas seismology that similar digital imaging technology is used on drill cores and each cubic centimeter produces hundreds of gigabytes of image data. A drill core is 45 meters long, and apparently the total amount of data for a single core can reach up to an exabyte– talk about big data!

On a final note, I received an email from my brother-in-law who said he read the blog post yesterday and had never heard of big data before. He went on:

I didn't understand what you meant when you wrote “expect to read or hear about it 3 more times in the next few days", but as I write this I guess you're referring to the predictive ability of big data. Anyway, having never heard the term I was just reading up on <another company>, when bingo came across “big data overview“.

What is Big Data?

This is the first post of a series on Big Data. Watch for more!

The success of information technology until now has been built on our ability to comprehensively record transactions, events, or changes of state. We have made great use of this transactional data, optimizing inventory, streamlining processes, automating activity. Now, however, we can track and record the behavior that leads up to, or follows from, these transactions. People use computers, phones, the internet to do more and more. Each click and call is recorded and makes up a web of behavioral patterns. Computers are used for designing, making, selling, buying, trading – each step along the way is recorded and makes up a web of behavioral patterns. Markets are now computerized and each bid, each offer, each trade is recorded. Each item of news about a market, a company, a financial asset is also recorded and cross-correlated to the market activity. Systems are observed in finer detail, and instrumented in real time, not just when a transaction occurs or a state changes. By analyzing all this behavior we hope to be able to diagnose, to predict, to intervene; we hope to sell more, or price better, to make more efficiently, to diagnose disease and design treatments. We want this behavioral data because it promises to unlock value commensurate with its volume, velocity and variety, and this behavioral data, is, um, big.

This data is so big, in fact, that it is causing problems in the technology world. That’s why it has this name: big data. You might not have heard this term until now, but now you have read it here, expect to read or hear about it three more times in the next few days. What exactly is big data? All the definitions seem based on a notion that the problems of size make it noteworthy. Wikipedia offers “In information technology, big data is a loosely-defined term used to describe data sets so large and complex that they become awkward to work with using on-hand database management tools.”

This doesn’t tell us why we have so much data or really why we should care. That is why I started this series on Big Data with this observation: we used to track transactions, and now we are tracking behavior.

Make no mistake, Big Data is about behavior – of people, systems, markets and machines.

At some stage, technology companies will solve the problems that make this data hard to ingest, handle, process, analyze, understand. It will no longer be big data, because it won’t be too big to manage.

However, without any doubt, behavioral data is here to stay!

A Map of Socio-economic Value Creation

Check out this wonderful diagram from Max Marmer’s essay published in The Startup Genome Blog (and also HBR). Also check out who he puts where on his chart (below). I could not have asked for a better illustration of the themes in my VC:VC series of posts, comparing and contrasting themes in for-profit and non-profit enterprises.

HBR-map-of-socioeconomic-value-creation-detailed-thumb-527x409-1650


Screen shot 2012-04-20 at 11.34.33 PM

I think there are some interesting and high-charge discussions about what falls to the left of the vertical axis. Are the net impacts of the Oil and Gas industry truly harmfully exploitative as seen over the arc of its history?

Looking at the opposite (bottom right) segment, I believe some economists would say that “Disease Treatment and Prevention” has a massive positive economic impact overall. In terms of harvesting value from this effort, the Pharma industry does, but most healthcare providers don’t. Perhaps there is a distinction between overall economic impact and who harvests value (or wealth creation). The airline industry, which, as an industry, has sometimes been entirely unprofitable also becomes difficult to place on this chart without that distinction.

Most intriguingly, where would you put your own current work on this chart?

Plans are worthless, but planning is everything

President Dwight Eisenhower once said “Plans are worthless, but planning is everything”. I agree with this and want to provide a little more nuance to my recent dismissive attitude to business plans.

In a recent discussion at Techstars Boston I heard about an angel investor who is considering a seed stage investment. Even though it is very early in the company’s life, the investor wanted to know whether or not there will be a later need for large amounts of venture capital funding. Angel investors would love to know which path will be taken in advance, because the VC route heralds the possibility of significant future ownership dilution. One of the entrepreneurs in the room noted that for his company he could make up some fancy spreadsheet which showed a business plan for either case. Each would be as plausible or possible as the other, but that wouldn’t provide any real insight to the angels. Spreadsheets like these are interesting scenarios, but absent other information we don’t know how likely they are to play out, so they really would be worthless plans.

My suggestion is to list the hypotheses the company expects to test, and what they plan to learn over the period funded by a seed round, and show how this would lead to one path or another. This is useful for both the entrepreneur and prospective seed investors. The deliverable is a list of the key areas of uncertainty and risk to be resolved through testing and learning, and the possible pathways that lead from the various outcomes. With this kind of plan an angel investor can use their own judgment about the future trajectory of the company. Yes, the output is a plan, but it is certainly not the usual kind of five year, revenue projections pulled-from-air, business plan that we might normally expect.

That is not the end of the story. Those five year plans may be worthless, but the planning really is everything. I do want to see some of those scenarios (check out my short article on presenting financials to dumb VCs). This is not because of the value of the numbers themselves, but because I gain insight into the thinking behind the plans. I get to understand the assumptions being made, the factors being considered (and not), and whether the various parts of the scenario at least make sense together. For example, if you plan to employ 3 sales reps and sell 30 deals a quarter, can you imagine each rep making a sale almost every week? (You would be surprised at the number of plans which fall apart at this level of review.) Entrepreneurs able to present some reasonable scenario show they have the ability to plan. That will come in handy once the data starts to show how the market and the company will perform. The plan probably is worthless; the ability to plan is everything.

[Although this post is written about how things work with for-profit start-ups, the same thinking applies to how donors and non-profits should be approaching new projects. Hence this is a VC:VC post. I wonder how many non-profit ventures do think about things this way. ]

Ride of Spring

As a Venture Cyclist I do feel I need to include a few posts about my riding. Today was my friendly riding group’s first ride of the season – a rite of spring. I cycled 25 miles at a decent pace (for me) on my trusty Bachetta Strada recumbent bike. The temps were 40s and 50s, and with warm, bright sunshine.

As James Brown once said: I feel good!

As a tip-of-the-hat to the 6-panel meme that is going around, here is one from me.Recumbent-6panel-meme

Four Reasons for a Business Model

This week at Techstars during my office hours sessions, I was asked questions by several teams which each time led to the same place: please draw a business model diagram for me. Everyone could, or said they could, but in each case it was clearly not a practiced exercise.

A business model is not a business plan, although the two are often confused. How can you tell the difference? A business model fits on one piece of paper (or one flip chart page or one white board), is referred to regularly, and has all sorts of uses. A business plan is a big pile of paper that even the author doesn’t read all the way through, and certainly no-one else does.

bizmodel
A business model
 

man-with-pile-of-paper1
A business plan

My favorite approach to a business model is (as previously mentioned) the Business Model Canvas. There are other approaches, but, to qualify, it must fit on one piece of paper, and must be a diagram of some kind.

Here are my four reasons to have a one-page business model picture

  • Completeness: you can make sure you have addressed all aspects of the business model. This is not exhaustive completeness – it should be quite high level and avoid getting into the weeds – but you get to see if you have any glaring holes.
  • Consistency: you can see whether all aspects of the business model are consistent with each other. For example, does the assumption about partners line up with the assumption about channels?
  • Clarity: you can see whether (and ensure that) all your colleagues are clear about what you are doing and why. If asked to draw the model independently, would they draw the same thing? The model becomes a concrete focus for discussion about how it all fits together and brings out any misunderstandings or disagreements about what you are doing.
  • Communication: you can draw and redraw the model as you tell the story of your business to mentors, advisers, potential recruits, and potential investors. It can focus a staff meeting, board discussion or investor presentation. You can much more easily remember a diagram (and recreate it from first principles) than you can remember a page of text.

If you have started to think about a business you have started to diagram things out. That’s where to start. Take an hour. Certainly stop after 90 minutes. Leave it on a white board. Share it with colleagues and advisors. Let them add post-it notes with questions. Go back to it with at least a couple of people around each time – let the brainstorming drive good thinking.

Don’t sweat the small stuff – even on the nine-sections of the Business Model Canvas, you only need six or seven elements to get going. Every company has “sales and marketing” as a Key Activity, and every tech company has “develop the tech platform” as well (and then “tech platform” shows up on the Key Resources panel, too). Don’t worry about that kind of completeness. Do worry about a value proposition for each customer segment, differentiated key assets and key partners, and revenue and cost components that characterize the economic drivers of the business. Advanced uses of a business model diagram include layering on key assumptions, generating explicit hypotheses, and building out tests of those assumptions.

On a very related note, Steve Blank recently wrote a great post on misunderstanding a business model methodology (and how to fix it). Heidi Allstop of Spill shared this great resource with me for those interested in an online canvas tool.

The thousand dollar genome–really close now

I loved seeing the recent Xconomy story about A Wowser Moment in DNA Sequencing – yes, getting close to that thousand dollar genome.

As a reminder, the thousand dollar genome is the idea that the cost to read the complete genetic sequence of an individual would be less than $1,000. An added goal is that it should be done for that price on-demand, and within a day. This excludes the case of a million dollar budget to sequence 1,000 peoples’ genomes over six months. This is about machinery that can be used in clinical settings the way labs process many urine or blood tests today.

This is also different than the services from 23andMe, Navigenics (and others) that offer a panel of specific genetic tests for a few dozen or few hundred specific genetic markers (eg for heart disease or Alzheimer susceptibility etc).

I first blogged about this here, in 2008. At that time I suggested it would take 10 years. About a year ago I mused that this was “not yet on the horizon”. I did say that “when it happens it will feel like it was overnight and will accelerate major changes in healthcare very quickly”. That part, at least, remains accurate. These are going to result in major shifts over the next decade.

What do you think, will you have your genome sequenced by 2020?

Existence Proof to Scale–From Point to Line to Curve

How do you grow a software business? What does growth look like?

pfgrf213

This is what growth looks like. It starts slow, almost linear, from zero, and then (we hope) accelerates. The horizontal axis is time. The vertical axis is, well, whatever you want, to start with (users, sign-ups, click-through rate, leads…), but always has to end up being revenue, profit, cash generated.

The Lean Startup world generally begins with considering a minimum viable product. I’d like to suggest that this starts even sooner (like our chart), with a point, a data point: some single case where a customer says yes and pays for something. At that moment you have a single data point of one customer who has paid some amount for one product. You started with a hypothesis that someone would buy your product, and someone did. That is an existence proof … a customer exists. Now you have to see whether you can repeat, perhaps with some adjustments along the way. Can you find another customer, and then another who buy from you and seem to be buying the same product for more or less the same reason. If so, you have shown some amount of repeatability. It might be an ugly process, where you have to spend huge amounts of time and effort finding the customers, improving the product, but you know you’ve arrived when each subsequent customer takes less time and effort than the one before. You are even more sure when someone you hired is able to follow your play-book and make a sale themselves. You have reached repeatability… you have drawn a line from your original starting point. Somewhere in the journey so far you have found your minimum viable product.

The next quest is for scalability. Scaling can be (often is) dangerous. You have to repeat at accelerating speeds. When you do this, if the expense of adding a new customer is higher than the revenue (or near term revenue) you earn (or cash you collect), then you lose money at a faster and faster pace. The journey from point (existence proof) to line (repeatability) is hard. The journey on to the knee in the curve (scalability) is hard and dangerous. If you succeed, you are able to add profitable growth by some predictable amount with every dollar of new investment in sales and marketing (see SaaS Magic Number, for example).

Finally you ride scalability to scale, become a large and successful company and file for a $5b IPO.

I framed this journey from Existence Proof to Scale as one about sales, but it is mirrored again in your operations and customer service. Once you sell your product you have to actually provide it, support it, maintain it, renew it, upgrade it. You have to go through the same process of finding an existence proof (phew, the first customer is up and running) to repeatability (we have to hold their hands each time, but the play-book seems to cover most cases) to scalability (hey, it’s all automated) to scale (we are supporting four gazillion customers around the globe, each costing pennies to deploy and support). Of course you have to embark on both these journeys in parallel, and profitability is about revenue covering the cost of both of these (and a few other things besides).

That’s not all. To even start on sales you had to get going on the same journey in software development (existence proof = proof of concept), minimum viable product (self-explanatory), repeatability (a process that allows for rapid implementation of new features and bug fixes), scalability (reliable product management, continuous deployment, scalable reliable operation) and then to scale (five 9’s reliability). The same goes for hiring: can you hire one good person and keep them? how about a few? how about keeping up with a scaling sales effort? how about maintaining a large global workforce and a healthy, vibrant corporate culture?

Each step on each path is worth its own blog post or its own book. Each journey is a book or a shelf of books. Each company growth curve chart is a complex history of hard, hard work, all to go from point, to line, to curve.
YouTube meme: S**t People Say

Satire isn’t always cruel, and mostly these videos are not. Satire does throw life into sharp relief, and these videos, a cross-section for my VC:VC theme certainly do. Some (most) are R-rated for language.


Sh*t Startup People Say from Venturebeat on Vimeo.

Yes, we do!

Very well worth the 61 seconds to watch to the end even if you are not a programmer.

Venn Diagrams of the World, Union!

geek-diagramAfter my posting What about Dweebs, which neatly shows a Venn Diagram taxonomy of Dweebs, Geeks, Dorks and Nerds, I let my obsessive side loose looking for other Venn Diagrams relevant to the various parts of my VC:VC world. In case you want to refer to it as I make wry comments later, I reproduce the picture here. It turns out there are a bunch of us obsessing about Venn Diagrams right now (some googling will confirm that).

UK


As a Brit, I liked this one, explaining the whole “United Kingdom of Great Britain and Northern Ireland” thing. 


And now, to prove I am a nerd, and a British one at that, a Venn Diagram Pun:

van-venn-diagram-560x469

VentureCyclistThe VC:VC construct itself is a Venn Diagram of some of my life interests … where my venture capital world, my cycling, and my community interests coincide (or overlap).


whatwedowell


Here’s another Venn Diagram I first saw on the walls of Techstars Boston, originally posted by Bud Cadell on his blog under the title How to be Happy in Business. This is a non-trivial commentary on building and running a business (geeks and nerds in particular need no further prompting to study this closely). SweetspotI found another variation on this theme on Flowing Data (which also links back to Bud’s graphic as well). Both make important points… but, if only business was so easy.  


Scale-Urgency-WillingnessToPayStan Nowak, Founder & CEO of Silverlink Communications, a Sigma portfolio company on whose board I sit, talks about the importance of seeking out markets with scale, urgency and willingness to pay. With a tip of the hat to Stan, here is it is as a Venn Diagram.


How about a diagram describing something technical… well, I previously shared my sketch of Dennis Devlin Devlin Security Diagsuggestion about information systems security, noting that a system is secure when it does exactly what it is supposed to do, and nothing more! (It strikes me this is a good definition of quality as well as security.) 


TwitterVenn


For fun, check out this interactive TwitterVenn website that uses a Venn Diagram to show overlap between terms you can find in the tweets over a the last day. You can use your own search terms … these are “chocolate, milk, hot”.


Over in the non-profit world, check out the questions Sasha Dichter asks with “The Simplest non-profit Venn Diagram ever”.ven-a2

How much overlap do think there is between the circles?


ven-b1

ven-c2

And finally, my own comment on how too few charities and too many startups are in the wrong place…

For-Not Profit Venn

Entrepreneurship–predefined

I quoted my friend Paul Gompers here and here in the past as saying that management is the optimization of resources and entrepreneurship is the optimization of opportunity.

Now I find what I assume is the original source of the quote from HBS professor Howard Stevenson:

Entrepreneurship is the pursuit of opportunity without regard to resources currently controlled.

This is a slightly purer form of the concept … not optimizing, but pursuing opportunity. I like it. Gompers’ juxtaposition of management and entrepreneurship is itself elegant and powerful, but more as a comparison than the Stevenson wording where entrepreneurship stands alone.

Hat tip to whoever pointed me at the Inc article where this was uncovered, apparently in a preview copy of the book Breakthrough Entrepreneurship by Jon Burgstone and Bill Murphy, Jr.

Why chocolate matters to a smarter planet

Why does anyone need to ask?

contentmediaexternalimagesmedia50

And what does this say about IBM, able to turn even chocolate into something just too earnest?

The Shortest Starbucks Order

StarbucksLid.JPGBack in 2006 I posted on The Longest Starbucks Order (it is still a good traffic-source from Google searches). Today I want to talk about my shortest Starbucks order: no lid, please.

I have realized over time that barista handling of the lids always leads to one of those “I wonder how often they wash their hands” moments.

This train of thought began one day in my local Peet’s. They don’t put the lids on your coffee for you. They have a stack of lids next to the milk, sugar and stirrers. Why do they do that, I wondered. After all, Starbucks goes the extra mile and puts the lid on for me. And then as I reached over to put the lid on for myself I was conscious that my hand was all over where my mouth was about to be … and that gave me pause for thought. Over at Starbucks, I thought, they put the lid on for me, and it’s the cleanliness of their hands I have to worry about, which is indeed a little more worrying that the cleanliness of my own (call me a snob).

Starbucks stores all seem to be uniformly scrupulous about maintaining cleanliness of the area behind the bar, the milk steamers, the spoons etc. The staff are careful to use tongs and tissue for food items, baked goods, hot breakfast snacks, to ensure they are not touching the food. However, when I order my drink, the baristas do not wear gloves and their bare hands are touching the lid, smooshing it down all around, including from where I am about to drink. And, perfectly understandably, for they are human after all, these pleasant, happy, well-trained baristas, touch their own face, sweep back their hair, touch each others’ hands as they pass cups … in short, their hands are short of food-prep hygienic. Movie reference: “Outbreak”… ugghhh!

I don’t want to make Starbucks baristas’ lives harder. I don’t want them to wear gloves. In fact I want to make their lives simpler. Please just stack the lids and let me place my own.