 I love numbers and charts. Let's play!
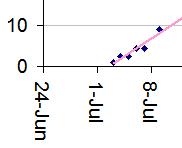
My bike rides to date have been 1, 2.5, 2.5, 4.5, 4.5 and 9 miles long. From this I can create a chart in Microsoft Excel.

The next question is whether I am on track for the New York ride, which involves ~60 miles on day one and ~40 on day two. So I add a linear trendline (in pink, see detail, above left) and have the chart extend out to September (full chart, right).
This begs the question: do I have to be doing 60 mile rides consistently if that is the one-time target? What length training rides get me on track to do 60 miles on the day? I know marathon runners don't run 26 mile training runs on a regular basis. So what do I need to build up to and when? 25 mile training rides? 30-40? Now I have more research to do and advice to find (your comments welcome below).
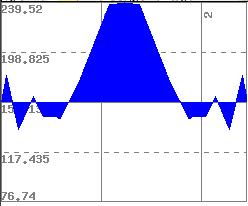 Here is another chart. This is from the Google Map Pedometer site I have mentioned in a previous post. It shows the elevation of my early 2.5 mile short out-and-back route (hence it is symmetrical around the mid-point).
I present this here to illustrate that (a) it does look like a heartbreaker of a hill, and (b) I really do have to go uphill both leaving home and uphill going back home, too.
No comments:
Post a Comment