This continues my occassional series on how cycling compares with Venture Capital, by looking for a J-curve in cycling.
In Venture Capital, we make investments and we work with companies, and it takes time to know whether the outcomes will be positive or negative. Failure tends to occur sooner than success. Failure may show when a company is unable even to get off the ground, or get past some tough early hurdles. For a company to succeed, however, it has to get over these early hurdles, and then work even harder, often for an extended period, before success is achieved. This is particularly true for the early stage investing that we are involved with at Sigma Partners.
Now, the money invested by each VC firm is organized into time limited portfolios known as funds. Like most VC firms, we imaginatively name our funds something like Sigma 1, Sigma 2 and so on (we are currently investing from Sigma 7). Generally a firm invests into new companies with a specific fund for two to four years or so. This uses 30-50% of that fund's total capital. During the remaining life of the fund the rest of the capital is used to support those companies. At that time a new fund is started to invest in the next group of startups.
Given that portfolio companies tend to fail faster than they succeed, if we invest in, say, 30 companies using a specific fund, then a couple of years into the fund several of our failures may have revealed themselves, but no successes are yet on the books. This makes it look like we have lost money so far for the fund as a whole. Later in the fund life, as the good companies mature, the value of the fund increases with the successes, and then heads up and to the right (steeply, we hope).
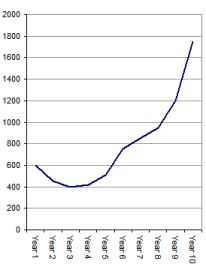 The chart on the right illustrates a fictional $600m fund.
As you can see, the graph looks somewhat like a "J", hence the name "J-curve" which is a familiar term in the VC world. The value at any given moment is the total value of the fund made up of investments at all the capital lifecycle stages, which are:
- as yet unspent (cash)
- written off (a $20m investment fails, so we deduct $20m from our value total)
- distributed to investors (we invested $20m and subsequently the company is sold or goes public, giving us proceeds of $200m, so we add $180 to our total)
- marked to some valuation while it continues to evolve (we invested $20m, events occur which demonstrate it is now worth $50m, so we add $30m to our total)
Where is the J-Curve in cycling?
If I sit low enough on my recumbent, with my legs in the air, I suppose I might look like a J-curve... but no - not that.
At the macro level I suppose I could drop out and be one of those early failures which never makes it, but that is more of a binary than linear (or J-curve) phenomenon - there is no portfolio here. Is the J-curve related to the hard work and investment which goes into any exercise regimen? Looking at investments and returns, you might think the time and effort (and dollars) it takes me to get going, get fit, get comfortable, get sponsored, all take me below the zero mark, before I start to see the value going up.
However, my experience (all two weeks of it so far) is that there is no J-curve. It is a straight up-slope.
I am having fun, getting fitter and more comfortable on the bike. I am learning lots, making new friends, blogging, thinking, raising money and awareness for Hazon ... these are all valuable from day one.
Let's hope it is not an n-curve!
The first post in my series comparing cycling with VC was: Is cycling a 10-bagger?
- Please sponsor me for the Hazon 2006 New York Bike ride.
No comments:
Post a Comment